Before sophisticated **algorithmic trading** became mainstream, traders relied on fundamental and manual chart analysis. The invention of technical indicators like RSI, EMA, Bollinger Bands, and MACD in the mid-20th century revolutionized market analysis by providing quantifiable insights into price action and momentum. These tools, born from a need for objective data, quickly became critical for quant traders to develop systematic strategies and are now fundamental components in modern AI trading bots, enabling precise, emotionless execution.
The Genesis of Trading Indicators: How RSI, EMA, and Bollinger Bands Empower Algorithmic Trading in 2026
Last updated: March 2026
TLDR: Before sophisticated algorithmic trading became mainstream, traders relied on fundamental and manual chart analysis. The invention of technical indicators like RSI, EMA, Bollinger Bands, and MACD in the mid-20th century revolutionized market analysis by providing quantifiable insights into price action and momentum. These tools, born from a need for objective data, quickly became critical for quant traders to develop systematic strategies and are now fundamental components in modern AI trading bots, enabling precise, emotionless execution.
The Chart Before the Lines: A World Without Indicators
Imagine a time when trading charts were just raw price data. No squiggly lines hinting at momentum, no bands predicting volatility, no crossovers signaling trends. For centuries, market analysis was a blend of instinct, fundamental news, and purely visual pattern recognition. Traders scrutinized ledgers and hand-drawn graphs, their decisions often swayed by gut feelings and the latest whisper on the trading floor. This pre-indicator era was a wild west, where systematic approaches were rudimentary, and the sheer volume of data made objective analysis a Herculean task. The need for a more scientific, quantifiable way to understand market movements was palpable, paving the way for a revolution.
The Birth of Precision: Key Indicators Emerge
The mid-20th century marked a turning point. As computing power slowly advanced, pioneering analysts sought to distill complex market behavior into simple, repeatable formulas. What emerged were the foundational technical indicators that still power algorithmic trading today.
Relative Strength Index (RSI): The Momentum Gauge (1978)
J. Welles Wilder Jr. introduced the RSI in 1978, a groundbreaking oscillator designed to measure the speed and change of price movements. Its creation stemmed from a desire to identify overbought and oversold conditions more objectively than prior methods. Wilder, a mechanical engineer by trade, applied his systematic thinking to trading, giving birth to a tool that quantifies the strength of recent price changes, making it indispensable for judging momentum and potential reversals.
Exponential Moving Average (EMA): The Smoother Trend (Early 20th Century)
While simple moving averages (SMAs) existed earlier, the Exponential Moving Average gained prominence for its responsiveness. Unlike SMAs, which weigh all data points equally, EMAs give more weight to recent prices, making them react faster to new information. This ""smoother"" trend line became crucial for traders seeking a clearer, less lagged view of price direction, a cornerstone for identifying trends and dynamic support/resistance levels.
Bollinger Bands: The Volatility Channel (1980s)
John Bollinger, a financial analyst and trader, developed Bollinger Bands in the 1980s. His innovation was to create a dynamic price channel that adapted to market volatility. The bands consist of a simple moving average (typically 20-period) with upper and lower bands set two standard deviations away. This ingenious design allowed traders to visually assess whether prices were high or low on a relative basis, and crucially, to gauge market volatility – a game-changer for strategies seeking price excursions or contractions.
Moving Average Convergence Divergence (MACD): The Trend-Following Dynamo (1970s)
Developed by Gerald Appel in the late 1970s, the MACD is a trend-following momentum indicator that shows the relationship between two moving averages of a security's price. By subtracting the longer-term EMA from the shorter-term EMA, then plotting a signal line (a 9-period EMA of the MACD itself), Appel created a powerful tool for identifying trend direction, momentum, and potential entry/exit points. Its simplicity and effectiveness quickly cemented its place in every serious trader's toolkit.
These indicators weren't just lines on a chart; they were mathematical interpretations of market psychology and mechanics, offering a new language for understanding price action. Learn more about how to apply these insights in practice with our guide on 3 Common Indicators Every Algo Trader Needs in 2026.
From Manual Charts to Mainstream Algorithms
The advent of these indicators was quickly embraced by the nascent field of quantitative finance. What began as tools for manual chartists soon became the building blocks for systematic trading strategies. Quant traders, with their focus on mathematical models and statistical analysis, recognized the power of these objective metrics.
By the late 20th and early 21st centuries, as personal computers became more powerful and internet connectivity grew, these indicators moved from niche financial desks to the mainstream. Retail traders gained access to charting software that could instantly calculate and display RSI, EMA, Bollinger Bands, and MACD. This democratization of tools coincided with the rise of automated trading systems and eventually, AI-driven bots.
For quant traders, indicators offered a crucial advantage: they provided clear, definable conditions for trade execution. Instead of subjective interpretation, a bot could be programmed to buy when RSI crossed above 30, or sell when MACD showed a bearish crossover. This shift from human intuition to rule-based logic was foundational for the entire trading bot strategy landscape. Today, these indicators are not just historical relics; they are living components within complex algorithms, constantly analyzed by AI to make split-second decisions. The ability to backtest strategies using historical data, a practice that relies heavily on indicator performance, further solidified their importance.
What Most People Get Wrong About Indicators
While powerful, technical indicators are often misunderstood. The biggest mistake most traders make is treating them as crystal balls that predict the future. Indicators are reactive, not predictive. They summarize past price action to give context to the present, but they don't guarantee future outcomes. Over-reliance on a single indicator, ignoring market context, or failing to understand their underlying math can lead to costly misinterpretations. For instance, an RSI showing ""oversold"" in a strong downtrend might simply indicate a brief pause before further decline, rather than a definitive reversal. Smart traders understand that indicators are tools to assist decision-making, not replace critical thinking or robust risk management.
How to Apply This on BuddyTrading
The evolution of trading indicators has culminated in platforms like BuddyTrading, where these historical tools are seamlessly integrated with cutting-edge AI and automation. You no longer need to be a quant expert to leverage sophisticated strategies built around RSI, EMA, Bollinger Bands, and MACD.
Explore the Marketplace: Browse a diverse range of strategies, many of which are built on the intelligent application of classic technical indicators. You can filter by strategy type and see performance metrics transparently.
Copy a Bot: Subscribe to a profitable bot that aligns with your risk tolerance and investment goals. These bots are often designed by experienced traders who have mastered the art of combining indicators for optimal entry and exit points.
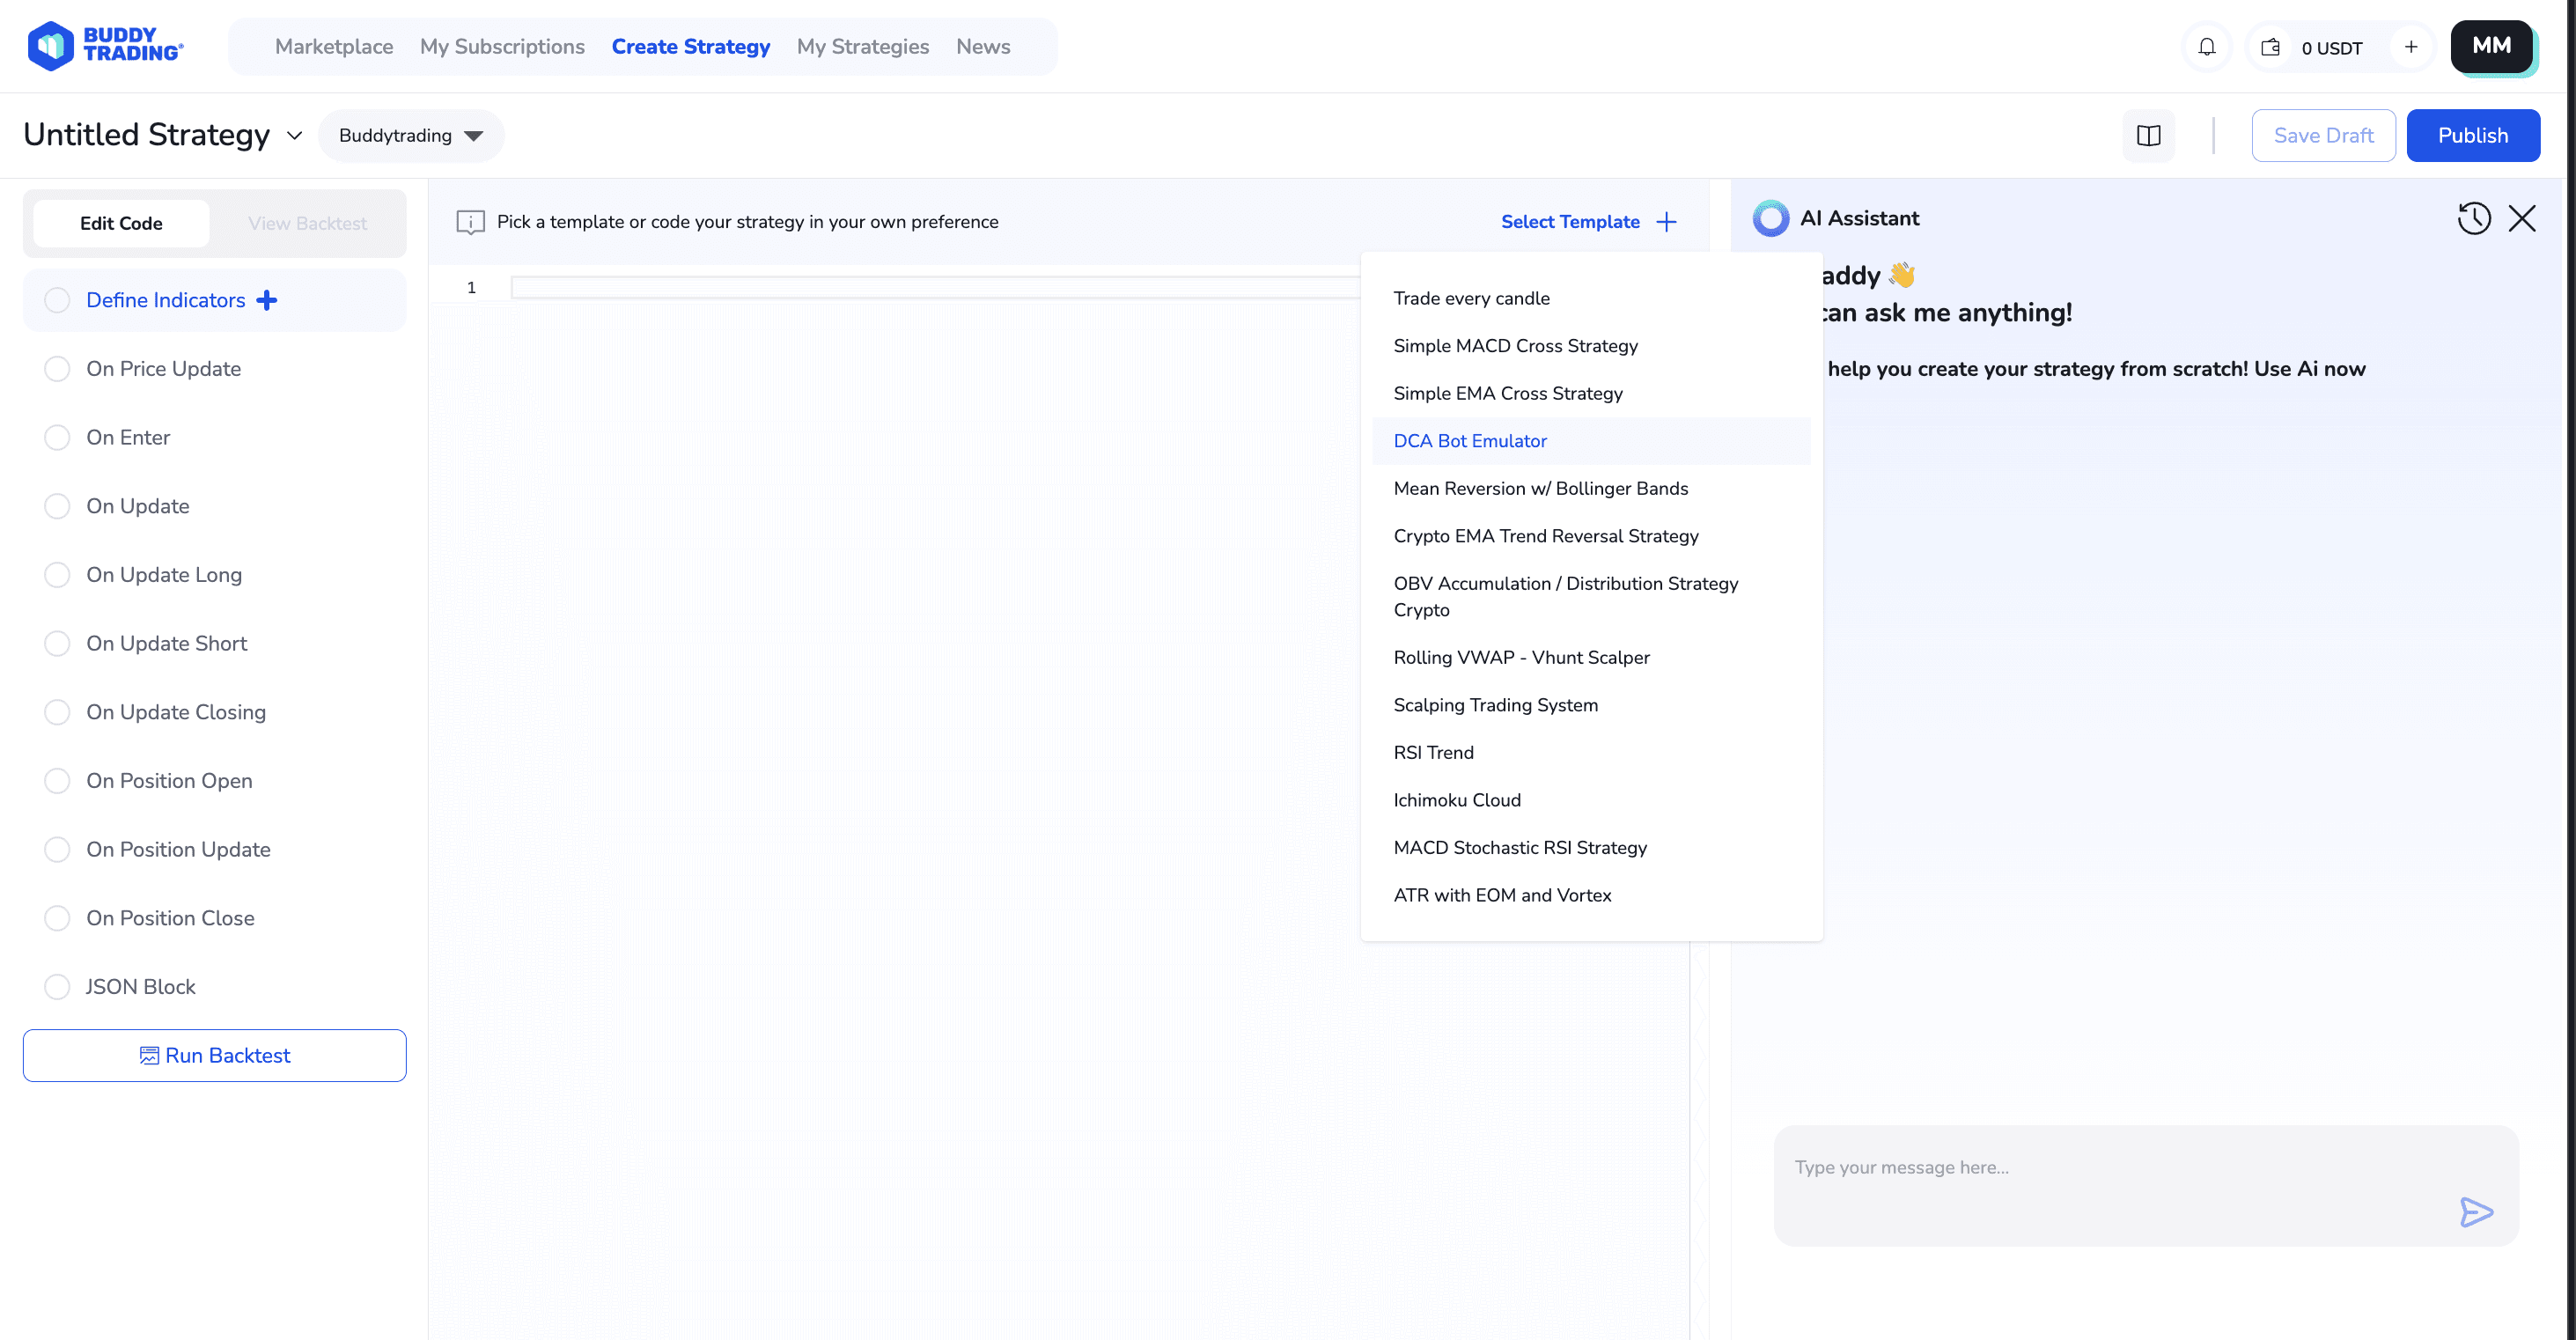
Build with AI: If you have an idea for a strategy using specific indicators (e.g., ""Draft a mean-reversion grid bot that uses Bollinger Bands for entry and exit""), simply prompt the BuddyTrading AI Assistant. Our AI will instantly wire the logic, requiring zero coding from your side.
This approach is faster and less risky than manual strategy building, allowing you to benefit from proven indicator-based logic without the complexity of coding or constant monitoring.
Bottom Line
Technical indicators like RSI, EMA, Bollinger Bands, and MACD were born from a need for objective market analysis in an era dominated by intuition.
These tools quantify price momentum, trend strength, and volatility, providing actionable insights beyond raw price data.
Their rule-based nature made them indispensable for early quant traders and are now fundamental to modern algorithmic trading and AI bots.
While powerful, indicators are reactive tools, not predictive ones, and should be used in conjunction with broader market context and robust risk management.
Platforms like BuddyTrading democratize access to indicator-based strategies, allowing anyone to copy proven bots or build their own with AI, without needing to code.
BuddyTrading does not provide regulated financial advice. Cryptocurrency and automated trading carry substantial risk, and past performance does not guarantee future results. This content is for educational purposes only. Only trade with capital you can afford to lose.
"

 Our Blog
 7 min read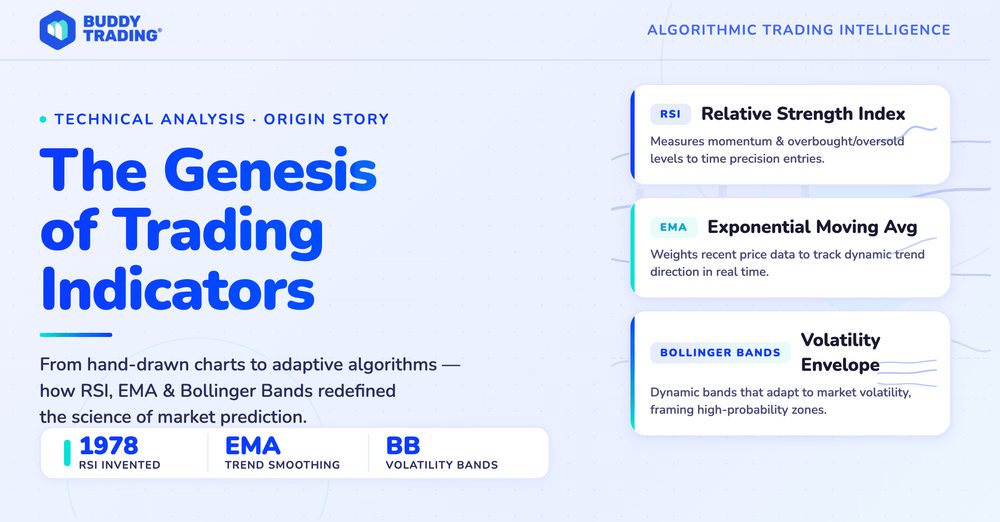

 Dec 18, 2025