A login link has been sent to your inbox. If it doesn't arrive in 3 minutes, be sure to check your spam folder.
 Our Blog
Understanding how to read crypto charts is one of the most empowering skills for any trader, especially beginners.

While the market can seem chaotic at first glance, charts reveal the patterns behind the price action. They help you make informed decisions, spot opportunities, and manage risk like a pro.
Let’s break down the basics of crypto technical analysis so you can start trading with clarity and confidence.
In a market that operates 24/7, data flows non-stop. Charts are your window into that data - translating complex market behavior into visual, trackable trends.
Charts help you:
And the best part? You don’t need a PhD in finance to start reading them.
Before diving into patterns and indicators, let’s look at the basic building blocks you’ll encounter on any trading chart.
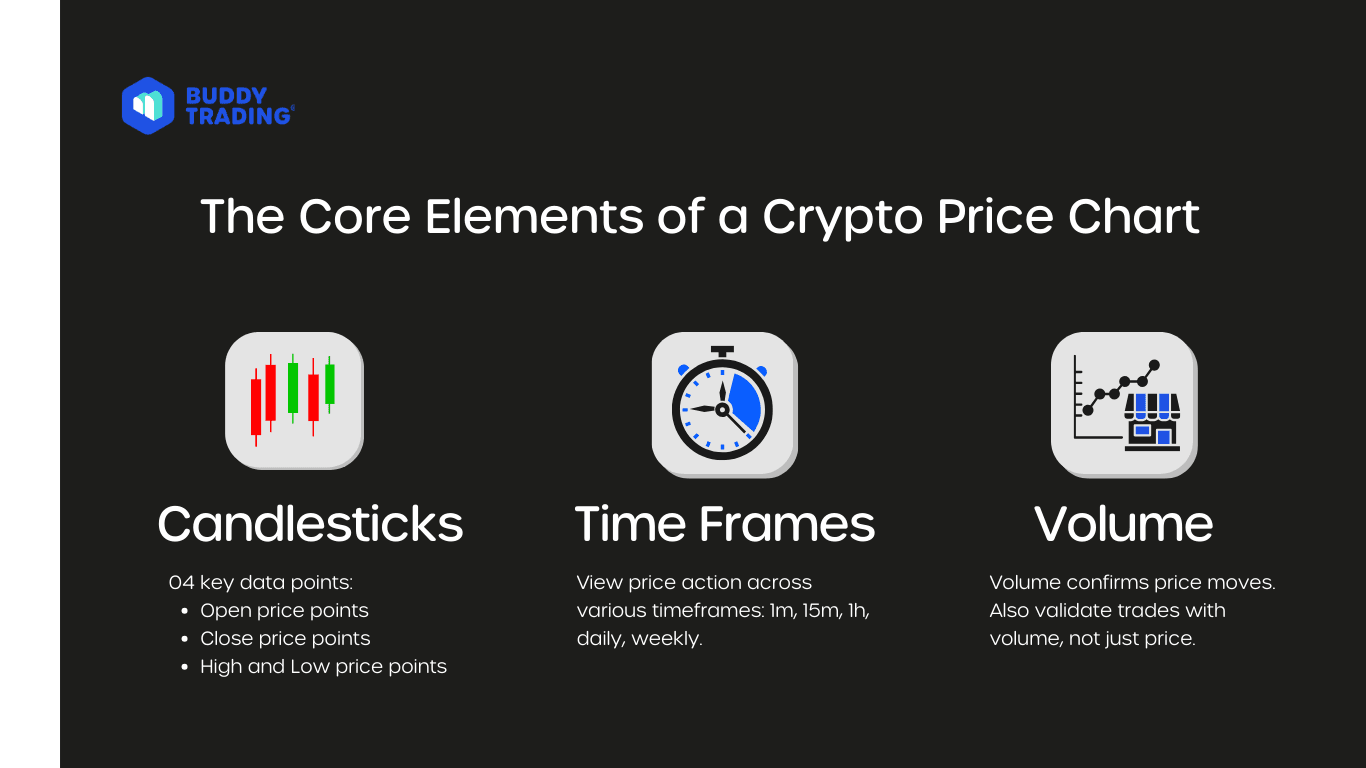
Each candlestick shows four key data points for a specific time frame:
If the close is higher than the open, the candle is typically green or white (bullish). If lower, it’s red or black (bearish).
Fun fact: Japanese candlesticks date back to the 1700s - originally used to track rice markets!
You can view price action over different periods - 1 minute, 15 minutes, 1 hour, daily, weekly, etc. Short-term traders (like scalpers) might look at 5-minute charts, while long-term holders focus on daily or weekly views.
Choosing the right time frame depends on your strategy.
Volume tells you how much of the asset has been traded. When price moves come with high volume, they’re more likely to be real and sustainable. But if a breakout happens on low volume, it could be a fake-out.
For example, if ETH breaks resistance at $3,000 on 30% above-average volume, it’s a stronger sign that buyers are committed.
Basic rules:
Use volume to validate your trades - not just price alone.
Pattern recognition is a key part of technical analysis. Here are three that even beginner traders can spot:
These are levels where the price tends to “bounce.” Support is the price floor; resistance is the ceiling.
This reversal pattern signals a trend change:
These patterns aren’t guarantees - but they give traders a higher-probability edge.
While price and volume give you a solid foundation, indicators offer extra insight. These are the most popular tools:
Smooth out price action to show trend direction. For beginners, start with:
The 50-day and 200-day moving averages are widely used by pros to track long-term trends.
A momentum indicator ranging from 0 to 100. It helps you spot overbought or oversold conditions:
According to a TradingView survey, 72% of crypto traders use RSI as one of their top 3 indicators.
Tracks the relationship between two EMAs. It helps spot momentum shifts and possible reversals.
The MACD is especially useful in trend-trading strategies, helping you ride momentum without chasing pumps or exits too early
Crypto charts can be thrilling… or terrifying. But real success lies in consistency and emotional control. A recent study by eToro found that emotional decisions account for nearly 68% of trading mistakes in retail traders.
That’s where platforms like BuddyTrading help. Instead of riding the emotional rollercoaster, you can mirror seasoned traders who follow data-driven strategies - helping you learn the discipline behind the indicators. Whether you’re a hands-on learner or prefer to follow the pros, BuddyTrading makes the journey smoother - letting you combine technical signals with real-time mentorship. You don’t need to go at it alone.
📢 Join the BuddyTrading community today!
🌐 Visit us: BuddyTrading.com
🐦 Follow us: @BuddyTradingApp
💬 Stay updated: https://t.me/BuddyTradingApp
🚀 Stay ahead with expert insights & real-time updates!

Subscribe to our newsletter and be the first to access exclusive content and expert insights.

CopyBot vs. CopyHuman: Which mirror trading style is better? Compare execution speed, emotion, and risk. Discover top-tier algorithmic strategies with Buddy Trading today.
 Dec 18, 2025
Learn how to promote your crypto trading bot with social selling from a marketing approach. Use GitHub, Discord, X, Reddit, and BuddyTrading to build trust and monetize strategies
Sep 17, 2025
Learn how we combined manual market analysis with Buddy Trading's AI to build a precision DCA bot. See the case study of a strategy that survived the Jan 2026 dip with a 100% win rate and <0.02% drawdown
Jan 9, 2026

 5 min read